Author: Lucas Peterson
-
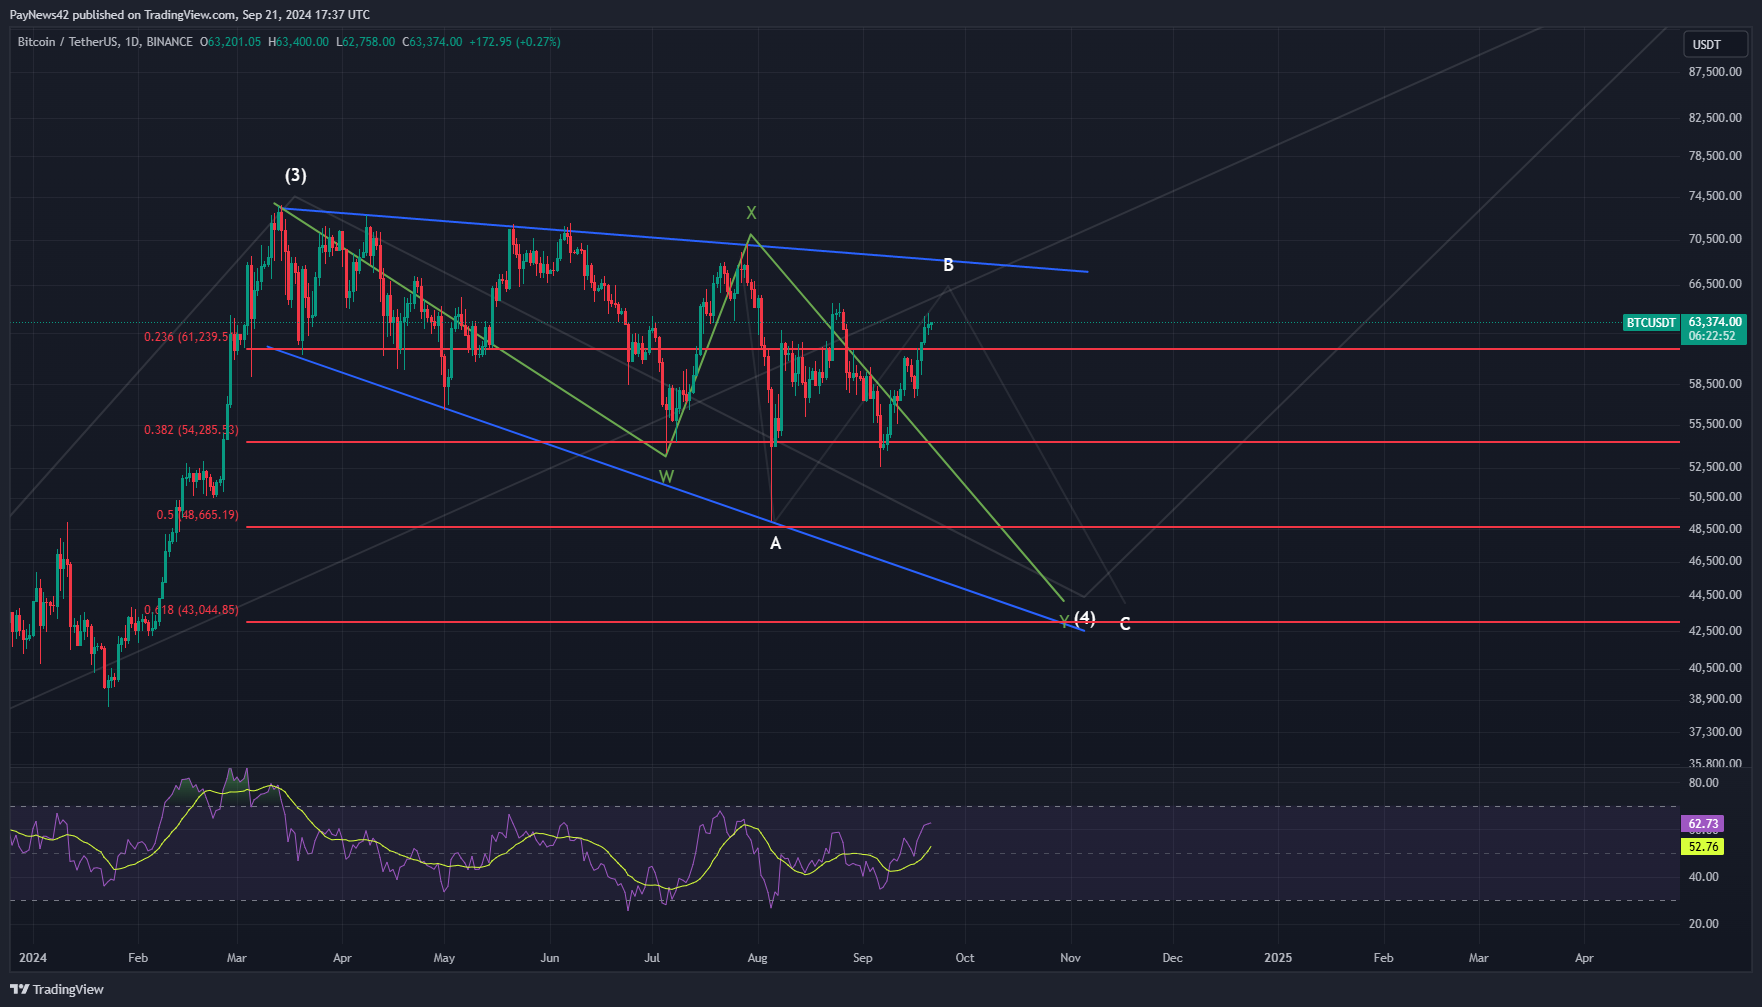
Bitcoin (BTC) Elliott Wave Analysis!
•
WXY Corrective Pattern Overview: Similar to our analysis on Solana, Bitcoin also appears to be following a WXY corrective structure. Within this pattern, the current market is completing a three-wave Y structure. We have already seen the completion of Wave A, and we are now navigating through Wave B, which…
-
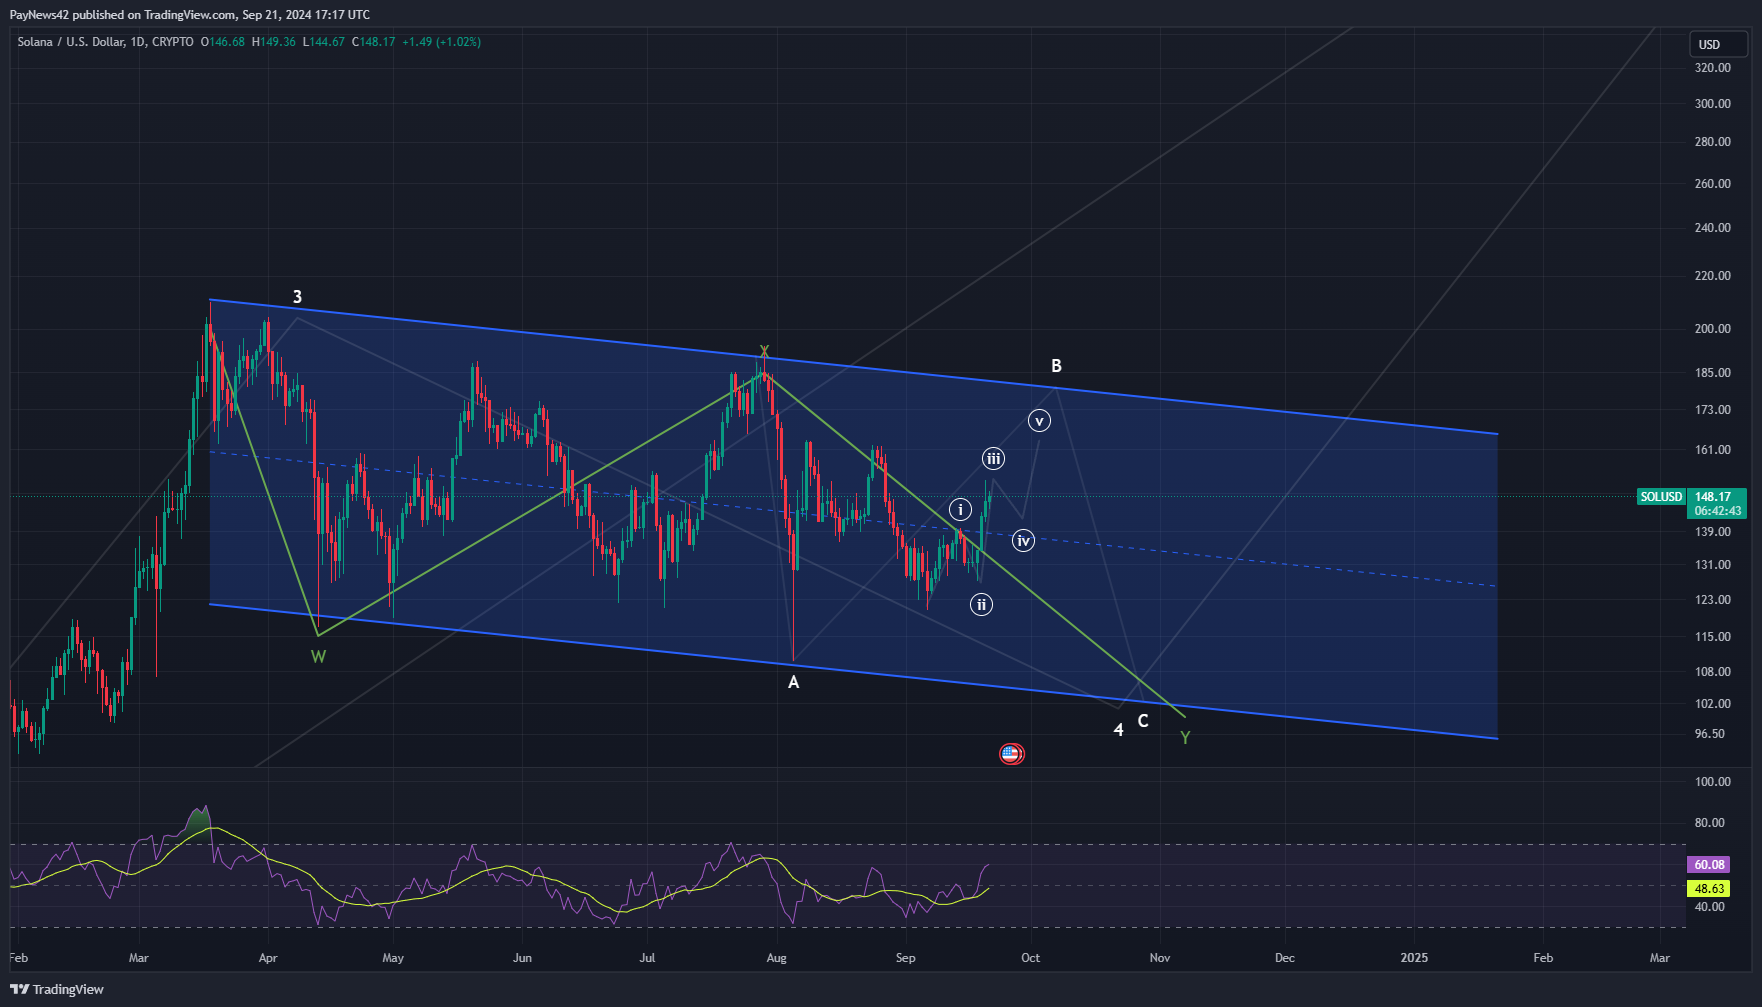
Solana (SOL) Elliott Wave Analysis:
•
WXY Correction and the Path Forward: Initially, Solana appeared to be consolidating within a triangle pattern, but the structure was erratic and lacked clarity. After re-evaluating the price action, we have re-labeled it as a WXY correction. This structure provides a cleaner and more coherent view of the current price…
-
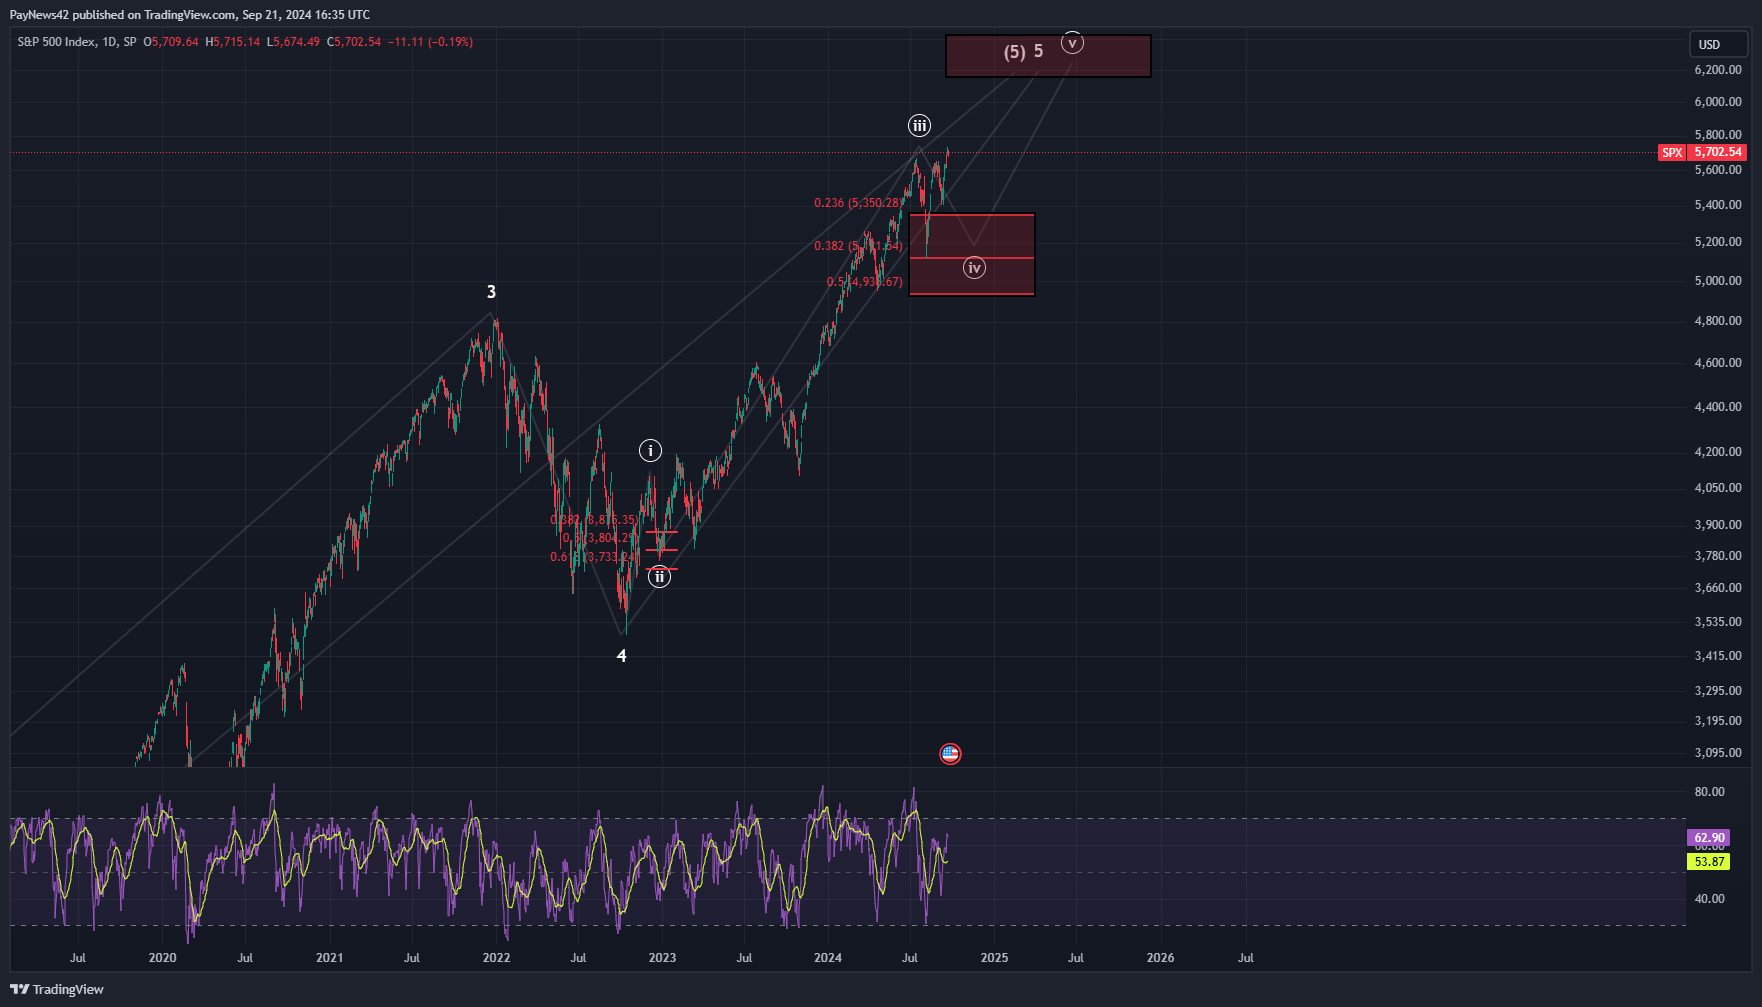
S&P 500 Elliott Wave Analysis
•
Current Elliott Wave Structure: We are currently tracking the 5th and final wave of a larger Elliott Wave cycle, specifically within Wave 4 of Wave 5 of the broader structure. Despite recent market activity, we believe that Wave 4 has not yet completed, and further downside potential remains. Looking closely…
-
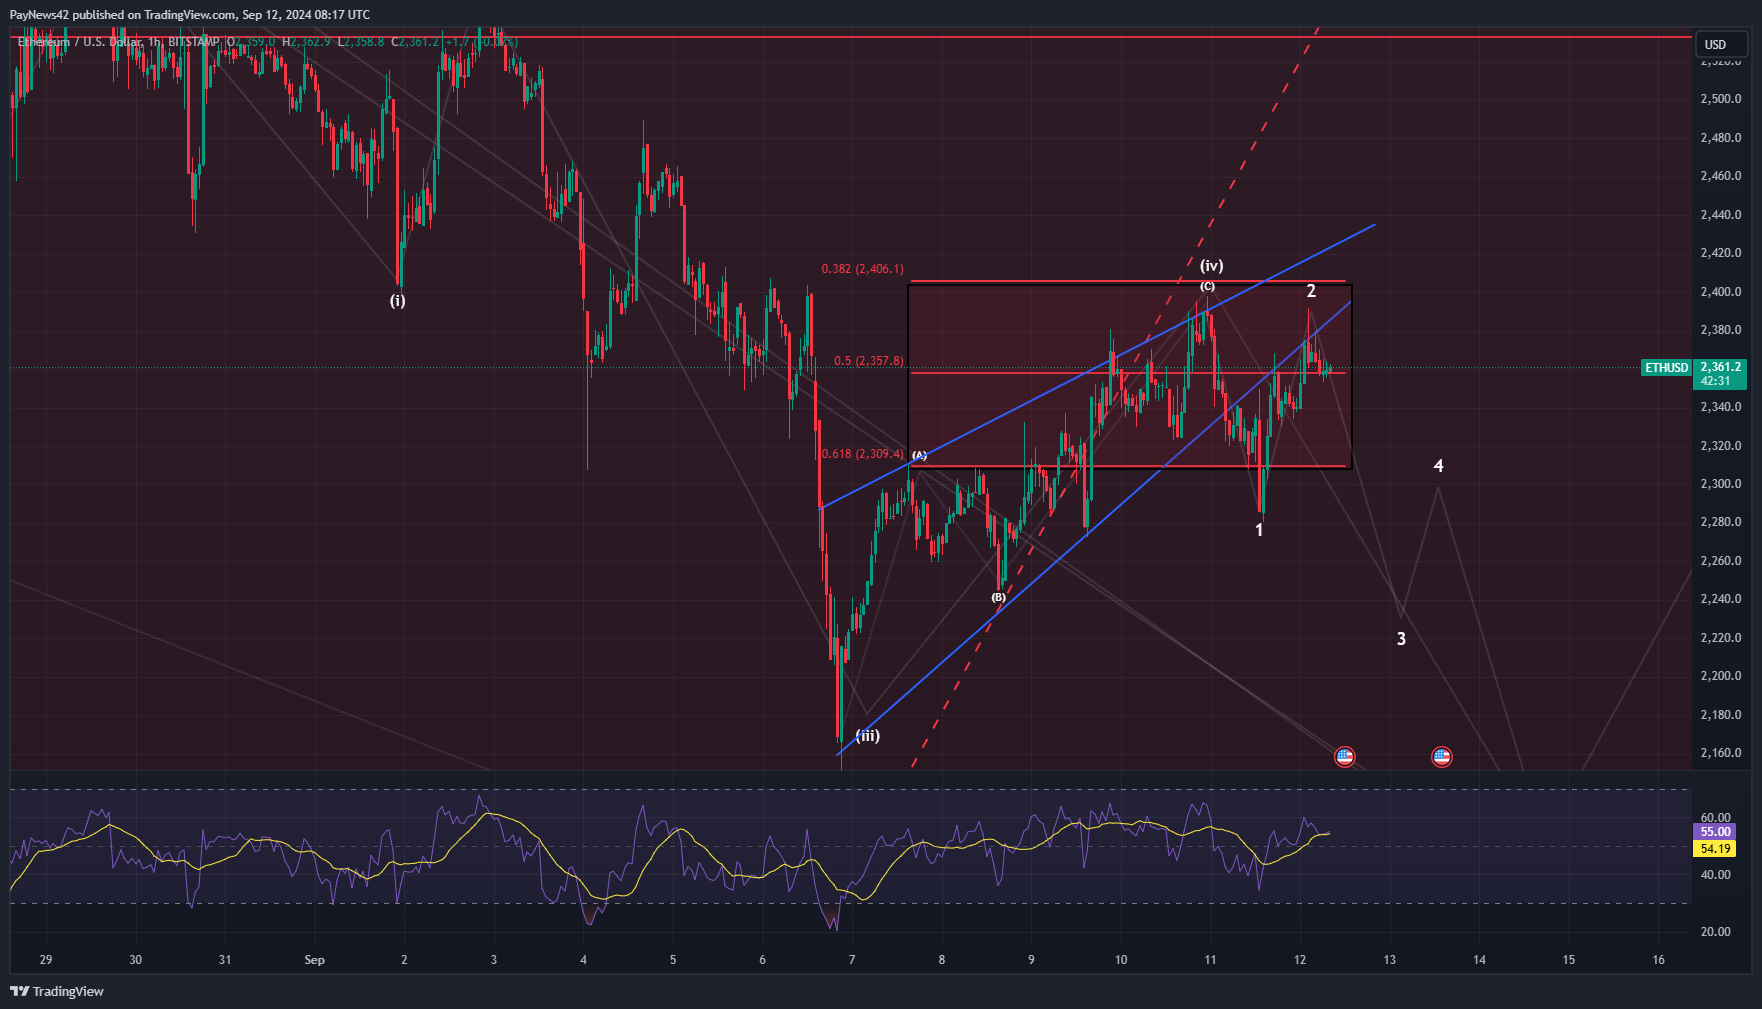
Elliot Wave Analysis of Ethereum
•
Ethereum’s current wave structure seems to suggest weakness, particularly as it fails to exhibit characteristics of a strong impulsive wave. The current structure, especially Wave 2, lacks the definitive strength typically seen in upward impulses. Instead, Ethereum seems to be developing into a more corrective structure, which could indicate the…
-
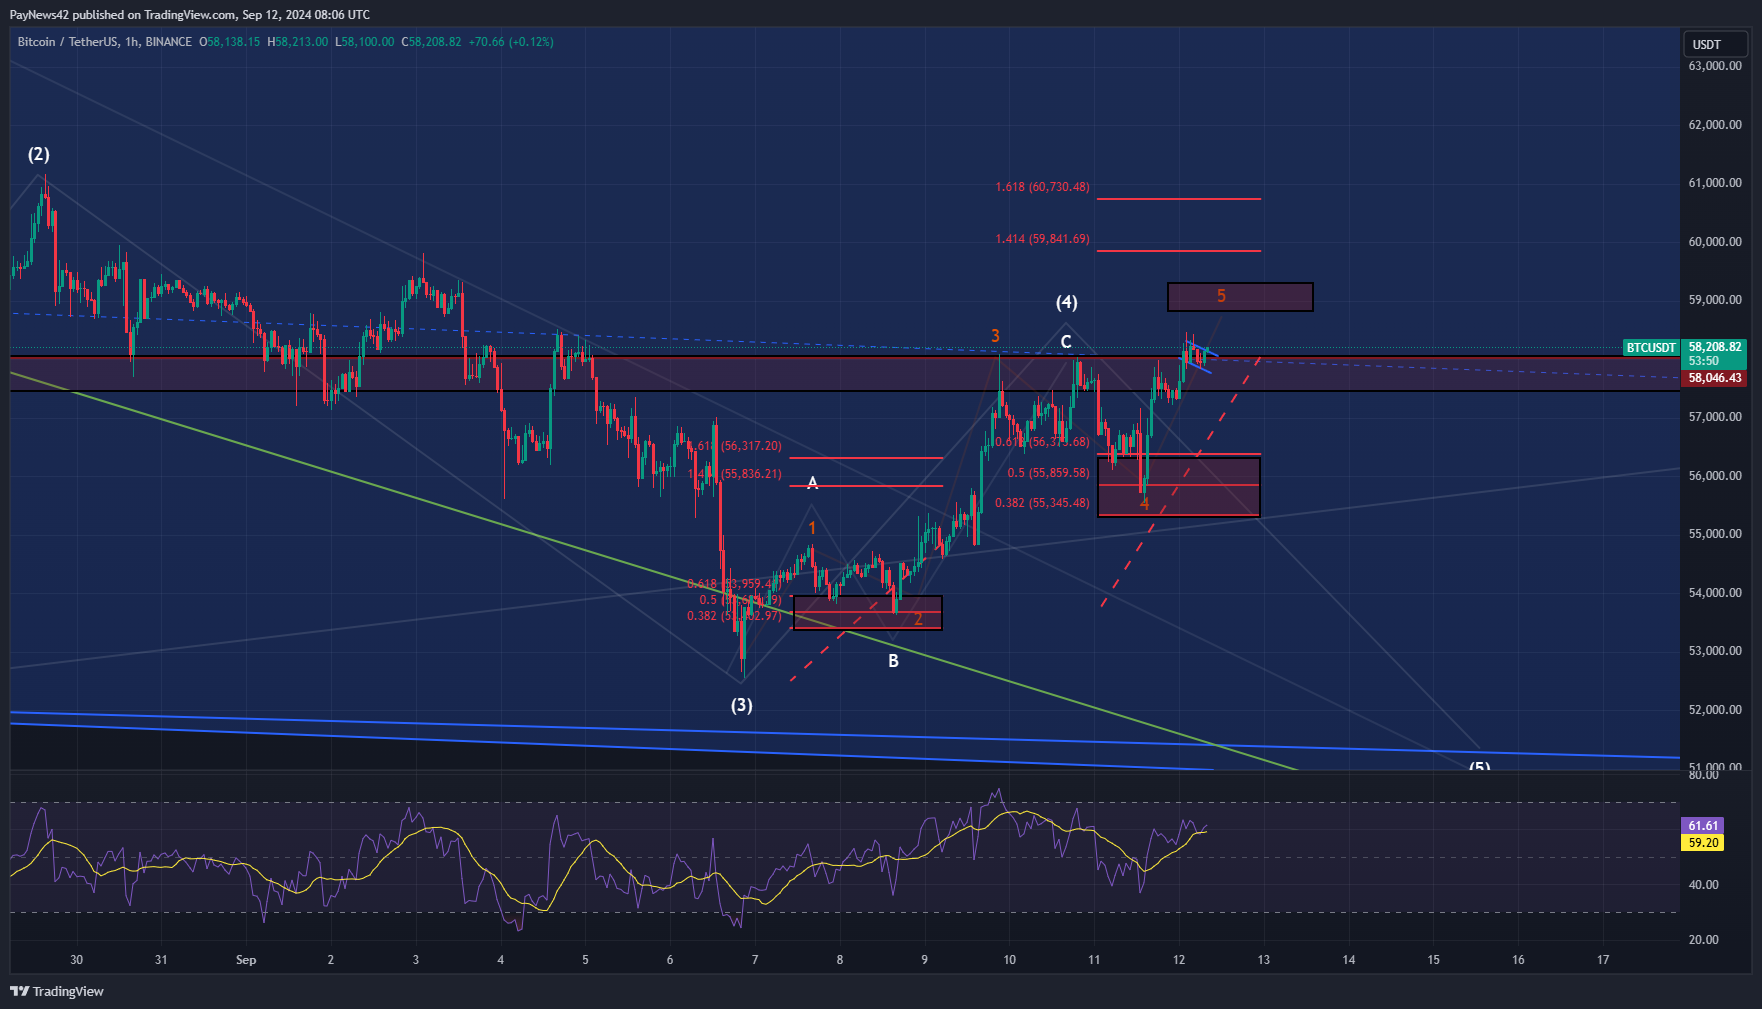
Bitcoin Elliott Wave Analysis
•
Bitcoin’s price action continues to display strength, and we have reintroduced the bullish scenario back into the chart analysis. As shown in yellow on the chart, Bitcoin has been respecting our key Fibonacci levels, both during the formation of Wave 2 and more recently in Wave 4. After finding support…
-
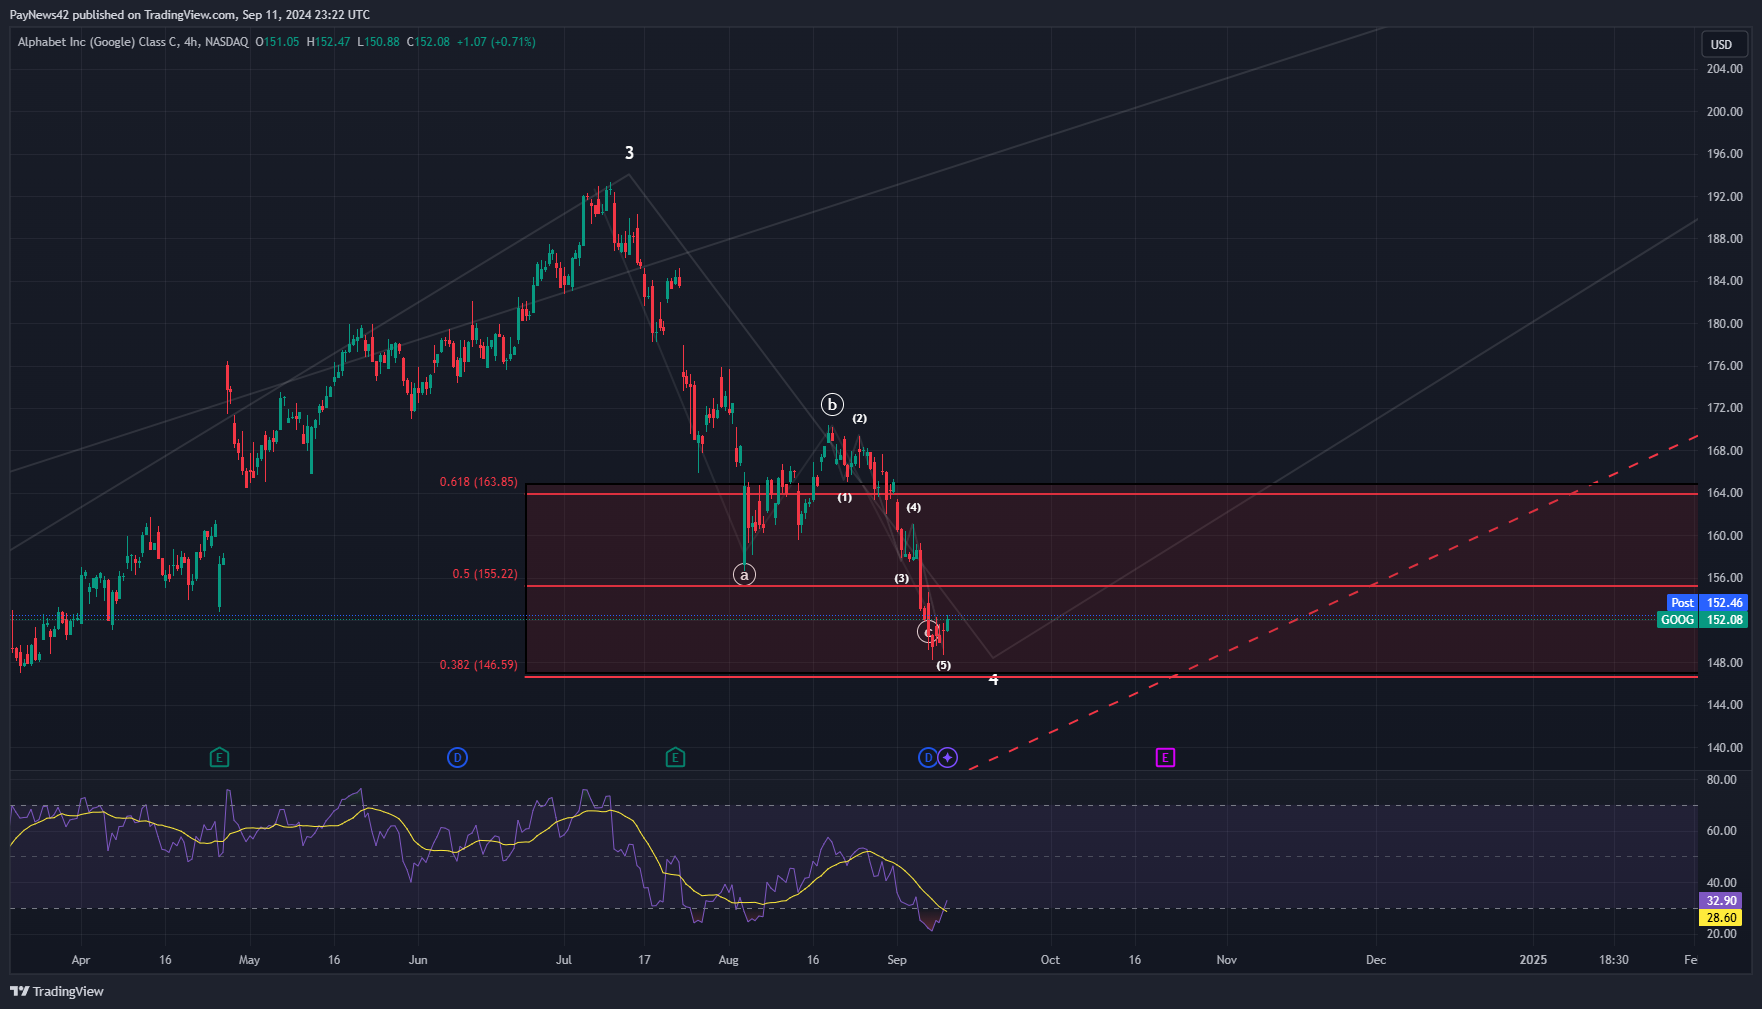
$GOOG Elliott Wave Analysis – Mid to Long Term Outlook
•
Market Structure: After reaching a significant high on July 11, 2024, Google ($GOOG) appears to have entered a corrective phase, which is typical following an impulsive move. According to Elliott Wave Theory, this looks like a Wave 4 correction after completing Wave 3 of a larger uptrend. Typically, Wave 4…
-
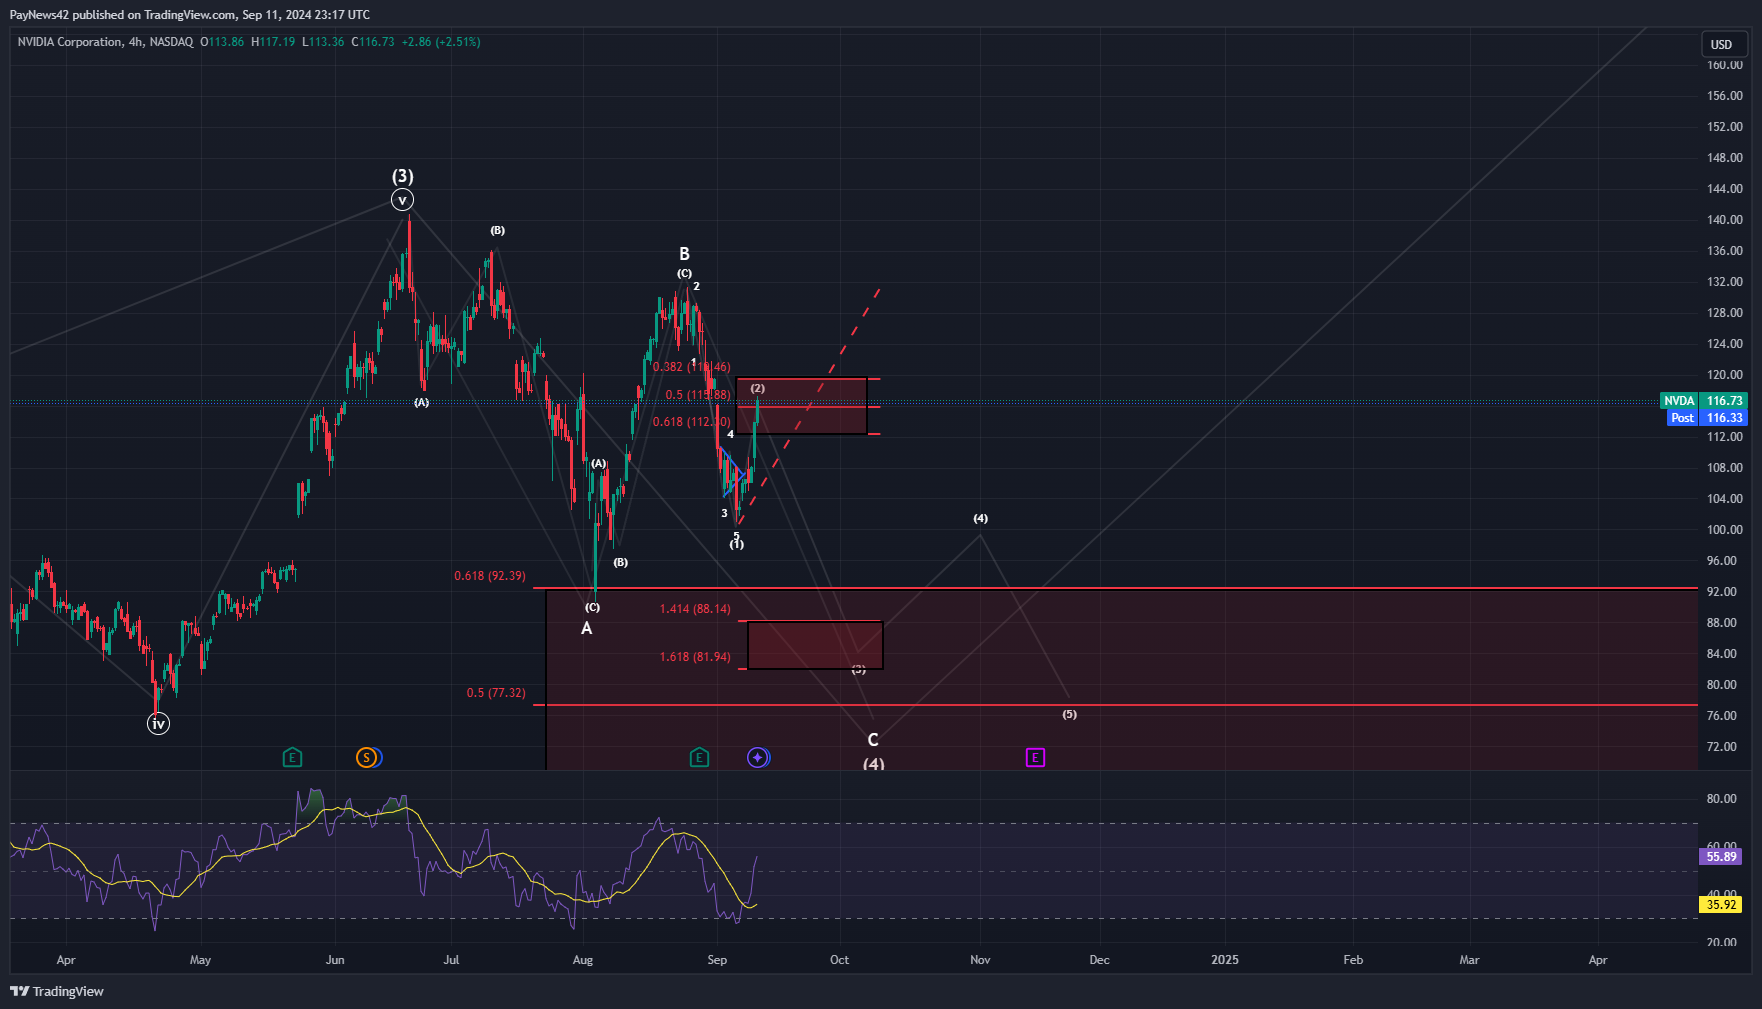
NVIDIA ($NVDA) Short-Term Elliott Wave Analysis!
•
Current Market Overview: NVIDIA ($NVDA) has continued its corrective path following a significant sell-off, previously referred to as “Black Monday 2.0.” This sell-off confirmed a corrective structure rather than a bullish impulsive move higher, which was crucial for understanding the ongoing market behavior. The bounce after this sell-off has been…
-
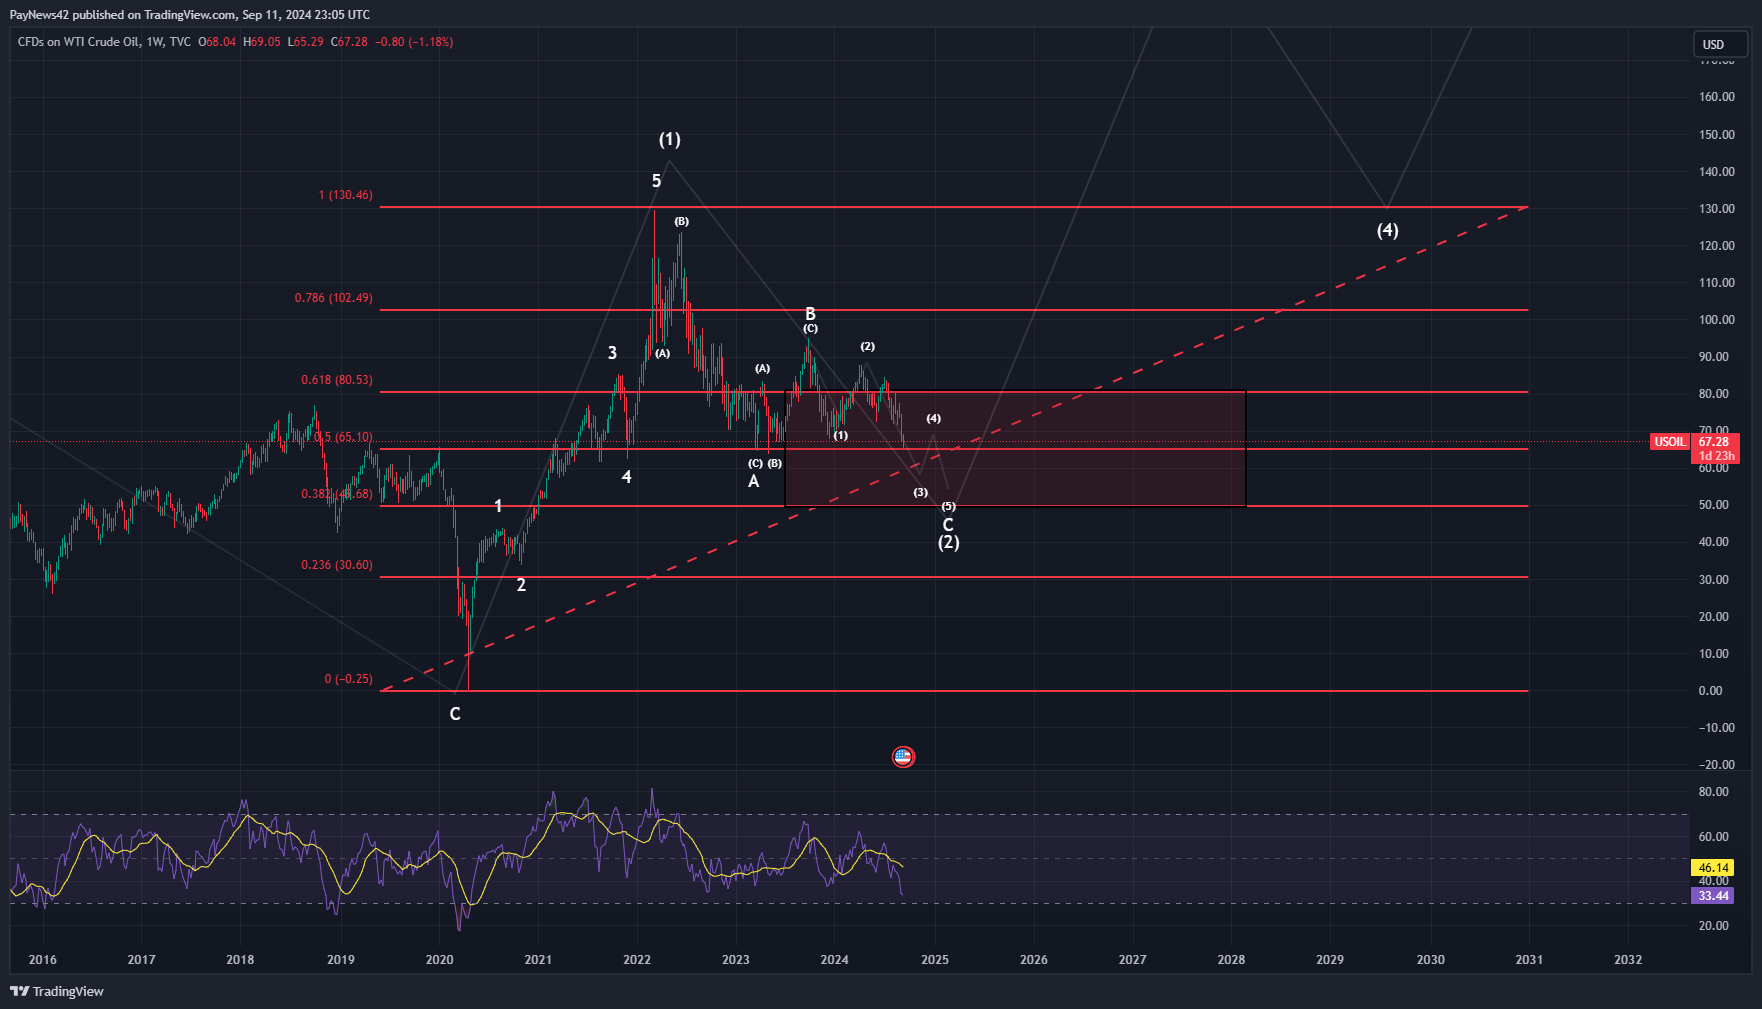
USOIL Elliott Wave Analysis – Detailed Overview
•
Current Market Structure: According to the Elliott Wave Principle, USOIL appears to be in a corrective phase, specifically in Wave 2 of the broader cycle. In this phase, we are observing what seems to be a three-wave structure, often called an ABC correction. This aligns with the common pattern where…
-
Gold Elliott Wave Analysis: Approaching a Key Correction Phase!
•
Current Market Scenario: Gold has recently hit a significant milestone in its bullish journey, reaching the target zone for Wave 3 between $2,362 and $2,718, as outlined in the Elliott Wave structure. This marks the culmination of an extended rally, but key indicators are pointing towards an impending correction. The…